Most law firm websites are slow on a phone. In a Lawzen review of 53 public law firm homepages in November 2026, 77% scored slower than Google’s 2.5-second loading target in a mobile lab test, and the median Largest Contentful Paint was 4.5 seconds. This post shows the numbers, the fixes I’d try first, and how to check your own law firm website speed in ten minutes.
Method and sample
We ran Google’s PageSpeed Insights on the mobile homepage of 53 firms, once each, in November 2026. The firms came from six web searches for a practice area and city: personal injury in Phoenix, criminal defense in Denver, family law in Charlotte, estate planning in Columbus, immigration in Houston and employment law in Seattle. We tested the homepage URL each firm uses in its search listing.
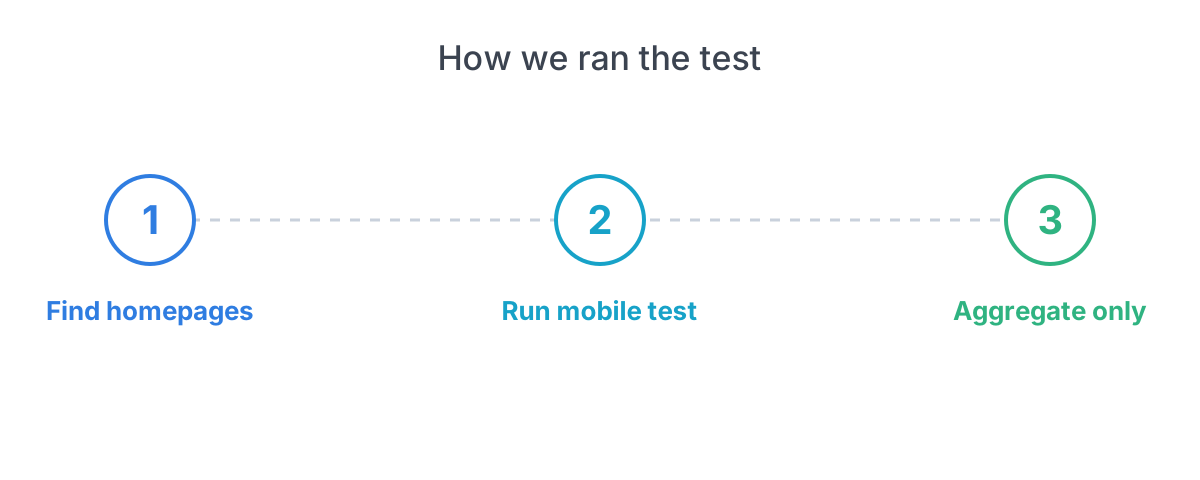
Treat this as a snapshot, not a census. The sample favors firms that rank well in search, so it may flatter the average firm site. We report totals only and name no firm, so you can’t look up who was fast or slow.
We also used each firm’s public homepage as it stood that month. Sites change often, and a redesign or a new plugin can move a score in either direction within days, so these figures describe one moment.
Two limits to know before you quote any figure:
- Lab data, one run. PageSpeed Insights runs a simulated mid-tier phone on a mobile network, and Google says scores can change between runs (Google, PageSpeed Insights docs).
- Field data is thin. Real-visitor data exists only for sites with enough Chrome traffic. Only 20 of the 53 homepages had any.
Headline results
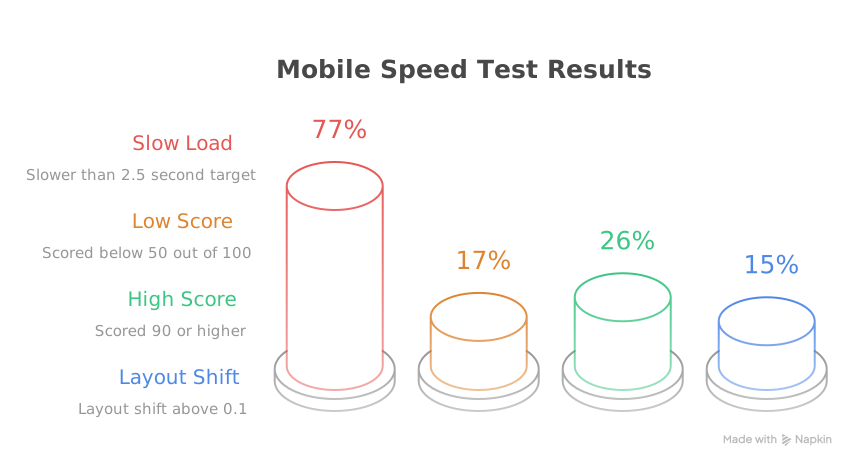
The typical firm failed Google’s loading target, but a quarter of sites did very well. Here is what 53 homepages looked like on mobile:
Largest Contentful Paint (LCP) is how long the biggest visible element, usually the top image or headline block, takes to appear. Google’s target is 2.5 seconds or less (web.dev, Core Web Vitals).
| Measure | Result (53 sites) |
|---|---|
| Median performance score | 68 of 100 |
| Median LCP | 4.5 seconds |
| LCP slower than 2.5 seconds | 41 sites (77%) |
| LCP slower than 4 seconds | 29 sites (55%) |
| Layout shift above 0.1 | 8 sites (15%) |
| Performance score under 50 | 9 sites (17%) |
| Performance score 90 or higher | 14 sites (26%) |
Lighthouse, the tool behind the score, rates 90 to 100 as good and under 50 as poor (Chrome for Developers). So about one firm in four was good and one in six was poor.
Layout shift (CLS) measures how much the page jumps while loading. The target is 0.1 or lower. Most sites passed, which is the one piece of good news here.
Accessibility was weaker than speed in one way: 13 sites also failed the tap-target check, which flags buttons and links too small or too close together for a thumb. The median accessibility score was 89, and 30 sites (57%) scored under 90. That score is a separate Lighthouse category and a topic for another post.
What does the spread tell us?
The gap between the best and worst homepages was huge. Our test records scores, not page contents, so I can’t tell you which plugin or image caused any one result. What the numbers do show is a wide spread: performance scores ran from 25 to 100. By LCP, the fastest homepages showed their main content in about one second, and the slowest took 16 seconds or more, with one over 40.
Here is a hypothetical, not a real firm: a three-lawyer injury firm in Phoenix. Say its homepage opens with a full-width photo of the team, a looping video and a chat widget. Each one adds work for the phone, and the big photo is often what LCP measures. A firm with one compressed photo and a plain phone button would likely load its first screen sooner with the same content.
I’d read the spread this way. Speed in this sample looks like a design choice more than a budget choice: the fast pages tend to ask the phone to do less. That is my judgment from the pattern, not a measured cause, so test your own site before acting on it.
Does page speed affect law firm SEO?
Google uses Core Web Vitals in ranking, but it is one signal among many. Google says its ranking systems use Core Web Vitals. It also says passing them doesn’t mean you will rank at the top, and that relevance still comes first (Google Search Central).
So don’t expect a speed fix to push you up the results alone. The more practical reason to care is the visitor: someone searching on a phone, often in a stressful moment, who will go back and call the next firm if yours stalls. If you work on your local SEO, speed is a cheap thing to get right early.
Fixes ranked by impact
Fix the first screen before anything else. This ranking is my judgment from how the metrics are weighted, not a measured result from the 53 sites. LCP and layout shift each carry 25% of the Lighthouse score, and blocking time carries 30% (same Chrome for Developers page), which is why most of these fixes target them. Fonts are the exception: they matter mostly for how soon text appears.
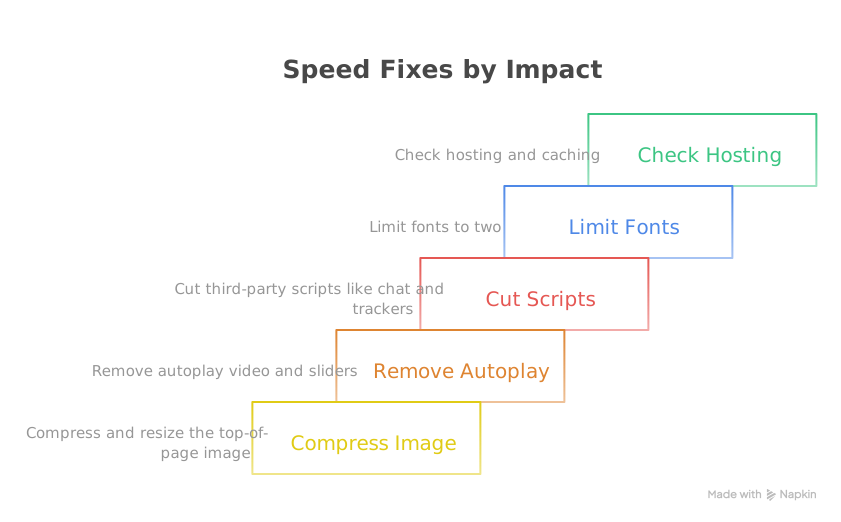
- Compress and resize the top-of-page image. A photo uploaded straight from a camera is often far larger than a phone screen needs. Export it at the display size.
- Drop autoplay video and image sliders from the homepage, or load them after the first screen.
- Cut third-party scripts. Chat widgets, trackers and review pop-ups each add work. Keep the ones you use and remove the rest.
- Limit fonts to two. Fewer font files means less waiting before text shows.
- Check hosting and caching if the first four don’t move the number. Cheap shared hosting can be slow before a single image loads.
Not every fix suits every firm. A video can earn its place if consultations are how you win cases; put it below the first screen. And a score of 100 is not the goal. Google itself says chasing a perfect score just for SEO reasons may not be the best use of your time.
How to test your own site
Run PageSpeed Insights on your homepage, then on your two most visited practice pages. It takes about ten minutes and costs nothing.
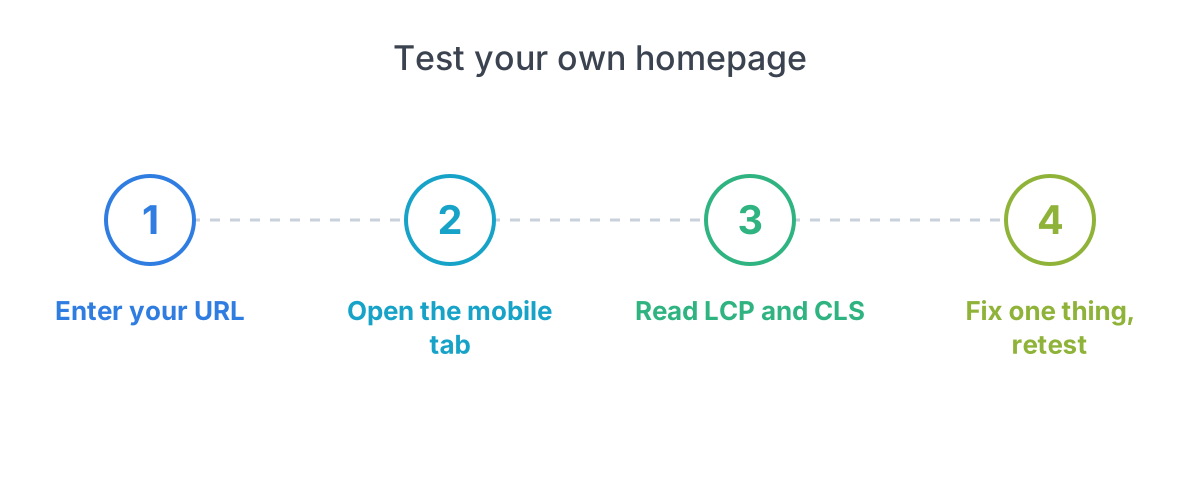
Read the field data first if the tool shows it. It reflects real visitors over the past 28 days, while lab data is one simulated run (Google).
Run the test three times and use the middle result, since single runs vary. Then change one thing at a time so you know what worked.
What is a good Core Web Vitals score?
Aim for LCP of 2.5 seconds or less, interaction delay (INP) of 200 milliseconds or less, and layout shift of 0.1 or less, measured at the 75th percentile of visits. That is Google’s published target (web.dev). Our test measured LCP and layout shift in the lab. INP needs real user input, so only field data reports it.
Where to start
- Run PageSpeed Insights on your homepage today and write down the mobile LCP.
- Fix the top-of-page image and remove anything that loads before the first screen needs it.
- If the number stays above 2.5 seconds, the cause may be your theme, plugins or hosting, and that is a conversation for whoever built the site.
The law firm website design guide covers the rest, and our list of common law firm website mistakes shows what else to check. If you’d rather hand it off, that is what Lawzen’s website design service is for.